How to Graph on a TI-84 Plus Calculator (2026 Guide)
The TI-84 Plus is a popular graphing calculator used for algebra, geometry, statistics, and calculus. It helps students graph equations and understand math concepts more easily. Many users only know the basics, but learning how to graph on a TI-84 Plus is simple once you know the right steps. This guide explains everything step by step. You will learn how to graph equations, functions, coordinates, inequalities, and absolute value expressions.
You will also learn how to graph on a TI-84 Plus to fix common graphing problems and get the most out of your TI-84 graphing calculator.
What Is a TI-84 Plus Graphing Calculator?
The TI-84 Plus graphing calculator can display graphs, tables, and equations, making it easy to learn how to graph on a TI-84 Plus and understand different math functions.
Popular models include:
- TI 84 Plus
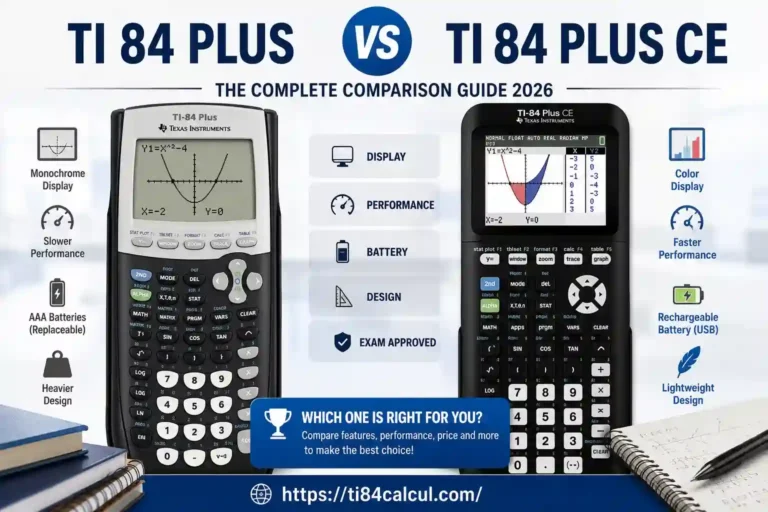
- TI 84 Plus CE
- TI 84 Plus CE Python
- Texas Instruments TI 84 Plus CE Graphing Calculator
Students use these devices because they simplify complex calculations and help visualize mathematical concepts.
Why Learn Graphing on a TI-84?
Learning how to graph on a TI-84 Plus helps you visualize equations, find intercepts, compare functions, and solve math problems more easily.
Graphing helps you:
- Understand equations visually
- Find intercepts
- Compare functions
- Analyze trends
- Solve algebra problems
- Explore calculus concepts
- Verify homework answers
A graph often reveals information that numbers alone cannot show.
Understanding the Main Graphing Buttons
Before graphing, learn the most important keys.
Y=
Stores equations.
WINDOW
Controls graph boundaries.
ZOOM
Adjusts viewing size.
GRAPH
Displays the graph.
TRACE
Moves along the graph.
TABLE
Shows equation values in a table. Understanding these buttons makes graphing much easier.
How to Graph on a TI-84 Plus Step by Step
Step 1: Turn On the Calculator
Press ON. Wait for the calculator to load.
Step 2: Open the Y= Screen
Press Y=. You will see several equation lines.
Step 3: Clear Existing Equations
Old equations may interfere. Move the cursor onto each equation. Press CLEAR.
Step 4: Enter an Equation
Example: y = 2x + 3
Type: 2X,T,θ,n + 3
The equation appears in Y1.
Step 5: Graph the Equation
Press GRAPH. The line appears instantly. You have successfully graphed your first equation.
ALSO READ : TI 84 Plus vs TI 84 Plus CE
How to Graph Linear Equations on TI-84
Linear equations create straight lines.
Examples:
- y = x + 2
- y = 3x − 1
- y = −2x + 5
To graph linear equations on TI 84:
Use TRACE to inspect points on the line.
How to Graph Quadratic Equations on TI-84
Quadratic equations create parabolas.
Example: y = x² + 2x − 3
Steps:
The graph appears immediately.
Quadratic graphs help identify:
- Vertex
- Maximum values
- Minimum values
- X intercepts
How to Graph Multiple Equations on TI-84
Students often need to compare functions.
Example: Y1 = x², Y2 = 2x + 1
Enter each equation on a separate line. Press GRAPH. The calculator displays both equations. This method helps find intersections visually.
How to Graph Functions on TI-84 Plus
The TI 84 Plus graphing calculator supports many function types.
Examples include:
- Polynomial functions
- Rational functions
- Exponential functions
- Logarithmic functions
- Trigonometric functions
Enter the function in Y= and press GRAPH. The process remains the same.
How to Graph Coordinates on TI-84
Coordinate plotting is useful for statistics.
Steps:
The points appear on the graph.
How to Graph Y Equals on TI-84
Many students search for how to graph y equals on TI 84.
Example: y = x² + 4
Enter the equation in Y1. Press GRAPH. The graph appears instantly.
Understanding Window Settings
A graph may not appear if the window settings are incorrect.
Press WINDOW.
Recommended values:
Xmin = -10
Xmax = 10
Ymin = -10
Ymax = 10
These settings work for most equations.
How to Zoom Out on TI-84 Graph
Some graphs appear too large. Press ZOOM. Choose Zoom Out. Press ENTER. Repeat until the graph fits the screen.
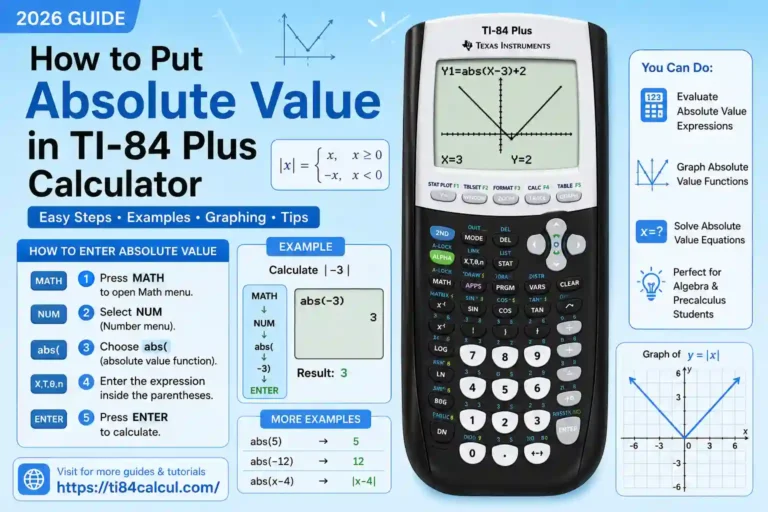
How to Put Absolute Value in TI-84 Plus
Example: y = |x|
Steps:
Press GRAPH. The graph forms a V shape.
How to Graph Absolute Value Functions
If you are learning how to graph on a TI-84 Plus, absolute value functions are a great place to start.
Example: y = |x − 3| + 2
Enter: abs(X−3)+2
Press GRAPH. The graph shifts 3 units to the right and 2 units upward, creating a V-shaped graph with a new vertex at (3, 2).
How to Graph Inequalities on TI-84 Plus
Some TI 84 Plus CE graphing calculator models support inequality graphing through applications.
Example: y > x²
Enter the inequality. Choose the appropriate shading option. Graph the result. The shaded region represents all solutions.
How to Graph XY² on TI-84 Plus CE
Many users search for how to graph XY² on TI-84 Plus CE.
For equations involving both x and y terms: xy² = 9
Use graphing modes designed for implicit equations if available. Many students also use Desmos for advanced implicit graphing because it handles these equations more easily.
How to Use TI-84 Plus CE for Graphing
The TI 84 Plus CE offers:
- Color graphs
- Faster processing
- Higher resolution
- Improved battery life
The graphing process remains similar to earlier models.
How to Graph on a TI-84 Plus CE Python
The TI 84 Plus CE Python combines graphing and coding.
To graph:
Python features do not change the standard graphing process.
How to Graph on a TI-83 Plus
Many students still use a TI-83 graphing calculator. If you already know how to graph on a TI-84 Plus, the process will feel very familiar because both calculators use similar graphing menus and controls.
The graphing steps are nearly identical:
Most graphing instructions apply to both calculators.
TI-84 Plus vs Desmos
Students often compare the TI 84 graphing calculator with Desmos.
TI-84 Advantages:
- Exam approved
- Reliable
- Portable
Desmos Advantages:
- Free
- Easy interface
- Faster graphing
Both tools are valuable. Many students use both.
Why Can’t I Graph on My TI-84 Plus?
Many students learning how to graph on a TI-84 Plus face graphing issues. Most problems come from incorrect window settings, enabled stat plots, or equation entry mistakes. A quick settings check usually fixes them.
Incorrect Window Settings
The graph exists but appears off-screen. Reset the window.
Stat Plots Enabled
Plots can interfere with graphing. Turn them off through STAT PLOT.
Wrong Graphing Mode
Check MODE settings. Use Function mode for standard equations.
Equation Entered Incorrectly
Review your syntax carefully.
TI-84 Graph Not Showing
If the graph does not appear:
Most graphing issues disappear after these steps.
TI-84 Graph Disappeared
Sometimes graphs vanish unexpectedly.
Common causes include:
- Zoom mistakes
- Window settings
- Deleted equations
Review these settings first.
How to Clear Graph on TI-84
Open Y=. Highlight unwanted equations. Press CLEAR. Graphing becomes cleaner and easier.
Reset Graph Settings TI-84
To restore default graph settings:
The calculator returns to a standard viewing window.
Advanced Graphing Tips
Use TRACE
TRACE helps inspect exact points.
Use TABLE
TABLE displays numerical values.
Find Intersections
Graph multiple equations. Use TRACE to compare values.
Analyze Behavior
Observe where functions increase or decrease.
Graphing for Algebra
Graphing helps students:
- Solve equations
- Understand slopes
- Compare functions
Algebra becomes more visual and intuitive.
Graphing for Calculus
Graphing calculators help with:
- Limits
- Derivatives
- Function behavior
Visual graphs support deeper understanding.
FAQs
How do you graph an equation on a TI-84?
Enter the equation in Y= and press GRAPH.
How do I graph y = -2x + 3?
Press Y=, enter -2X+3, then press GRAPH to see the line.
How do I graph on a calculator?
Enter your equation in the graph menu and press GRAPH to display it.
Does TI-84 have graphing?
Yes, the TI-84 is a graphing calculator that can graph equations, functions, and data.
Why won’t my TI-84 calculator graph?
Check your equation, window settings, and make sure stat plots are turned off.
Can I graph coordinates on a TI-84?
Yes. Use lists and scatter plots.
Conclusion
Learning how to graph on a TI-84 Plus makes math much easier. Once you know how to enter an equation, adjust the graph window, and use zoom tools, creating graphs becomes simple. Whether you use a TI-84 Plus, TI-84 Plus CE, TI-84 Plus CE Python, or TI-83, the basic steps are the same. Enter your equation, press GRAPH, and view the result.
With regular practice, you can graph equations, functions, coordinates, inequalities, and other mathematical relationships with confidence. Mastering how to graph on a TI-84 Plus will help you succeed in algebra, precalculus, calculus, statistics, and many other math courses.